IMD GOA & DELHI#
import pyscancf as pcf
import pyart
import matplotlib.pyplot as plt
## You are using the Python ARM Radar Toolkit (Py-ART), an open source
## library for working with weather radar data. Py-ART is partly
## supported by the U.S. Department of Energy as part of the Atmospheric
## Radiation Measurement (ARM) Climate Research Facility, an Office of
## Science user facility.
##
## If you use this software to prepare a publication, please cite:
##
##     JJ Helmus and SM Collis, JORS 2016, doi: 10.5334/jors.119
## Cite PyScanCf:

## Syed, H. A., Sayyed, I., Kalapureddy, M. C. R., & Grandhi, K. K. (2021).
## PyScanCf – The library for individual sweep datasets of IMD weather radars.
## Zenodo. https://doi.org/10.5281/zenodo.5574160
input_folder = "/Users/syed44/Downloads/Others/Git_Stuff/imd_temp_radar/B/"
output_folder = "/Users/syed44/Downloads/Others/Git_Stuff/imd_temp_radar/out2/"
!ls $input_folder
ls: cannot access '/Users/syed44/Downloads/Others/Git_Stuff/imd_temp_radar/B/': No such file or directory
pcf.cfrad(
    input_dir=input_folder,
    output_dir=output_folder,
    scan_type="B",
    nf=10,
    gridder=True,
    plot="Z",
)
2025-04-19 06:27:39,221 - INFO - Packing 0 sweeps into 0 volumes
2025-04-19 06:27:39,221 - INFO - Data merging done
Time Taken: 0:00:00.132989
grid = pyart.io.read_grid(output_folder + "grid_GOA210516024101-IMD-B.nc")
---------------------------------------------------------------------------
FileNotFoundError                         Traceback (most recent call last)
Cell In[5], line 1
----> 1 grid = pyart.io.read_grid(output_folder + "grid_GOA210516024101-IMD-B.nc")

File ~/checkouts/readthedocs.org/user_builds/pyscancf/envs/stable/lib/python3.13/site-packages/pyart/io/grid_io.py:75, in read_grid(filename, exclude_fields, include_fields, **kwargs)
     48     exclude_fields = []
     50 reserved_variables = [
     51     "time",
     52     "x",
   (...)     72     "ProjectionCoordinateSystem",
     73 ]
---> 75 dset = netCDF4.Dataset(filename, mode="r")
     77 # metadata
     78 metadata = {k: getattr(dset, k) for k in dset.ncattrs()}

File src/netCDF4/_netCDF4.pyx:2521, in netCDF4._netCDF4.Dataset.__init__()

File src/netCDF4/_netCDF4.pyx:2158, in netCDF4._netCDF4._ensure_nc_success()

FileNotFoundError: [Errno 2] No such file or directory: '/Users/syed44/Downloads/Others/Git_Stuff/imd_temp_radar/out2/grid_GOA210516024101-IMD-B.nc'
grid.fields.keys()
dict_keys(['T', 'Z', 'V', 'W', 'ROI'])
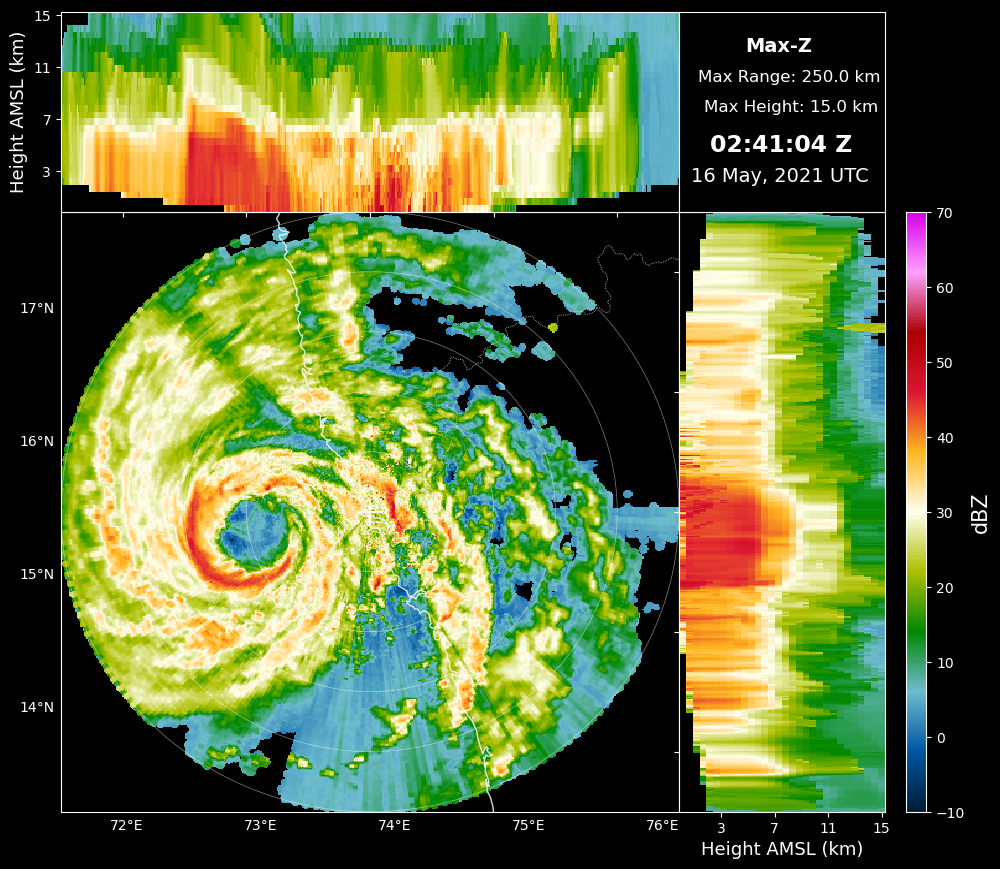
with plt.style.context(["dark_background"]):
    pcf.plot_cappi(grid, "Z", vmin=-10, vmax=70, cmap="SyedSpectral")
plt.show()
...............................
Plotting Max-Z 20210516024104
...............................
input_folder = "/Users/syed44/Downloads/Others/Git_Stuff/imd_temp_radar/dualpol/"
output_folder = "/Users/syed44/Downloads/Others/Git_Stuff/imd_temp_radar/out2/"
!ls $input_folder
DLI190724051233-IMD-B.nc   DLI190724052230-IMD-B.nc
DLI190724051233-IMD-B.nc.1 DLI190724052230-IMD-B.nc.1
DLI190724051233-IMD-B.nc.2 DLI190724052230-IMD-B.nc.2
DLI190724051233-IMD-B.nc.3 DLI190724052230-IMD-B.nc.3
DLI190724051233-IMD-B.nc.4 DLI190724052230-IMD-B.nc.4
DLI190724051233-IMD-B.nc.5 DLI190724052230-IMD-B.nc.5
DLI190724051233-IMD-B.nc.6 DLI190724052230-IMD-B.nc.6
DLI190724051233-IMD-B.nc.7 DLI190724052230-IMD-B.nc.7
DLI190724051233-IMD-B.nc.8 DLI190724052230-IMD-B.nc.8
DLI190724051233-IMD-B.nc.9 DLI190724052230-IMD-B.nc.9
pcf.cfrad(
    input_dir=input_folder,
    output_dir=output_folder,
    scan_type="B",
    nf=10,
    gridder=True,
    dualpol=True,
    plot="Z",
)
2025-04-19 01:31:34,438 - INFO - Packing 20 sweeps into 2 volumes
2025-04-19 01:31:34,439 - INFO - Processing volume 1
2025-04-19 01:31:36,430 - INFO - Saved cfrad_DLI190724051233-IMD-B.nc
2025-04-19 01:31:54,898 - INFO - Saved grid_DLI190724051233-IMD-B.nc
2025-04-19 01:31:54,899 - INFO - Processing volume 2
2025-04-19 01:31:56,758 - INFO - Saved cfrad_DLI190724052230-IMD-B.nc
2025-04-19 01:32:15,755 - INFO - Saved grid_DLI190724052230-IMD-B.nc
2025-04-19 01:32:15,755 - INFO - Data merging done
Time Taken: 0:01:14.836905
grid.fields.keys()
dict_keys(['T', 'Z', 'V', 'W', 'ROI'])
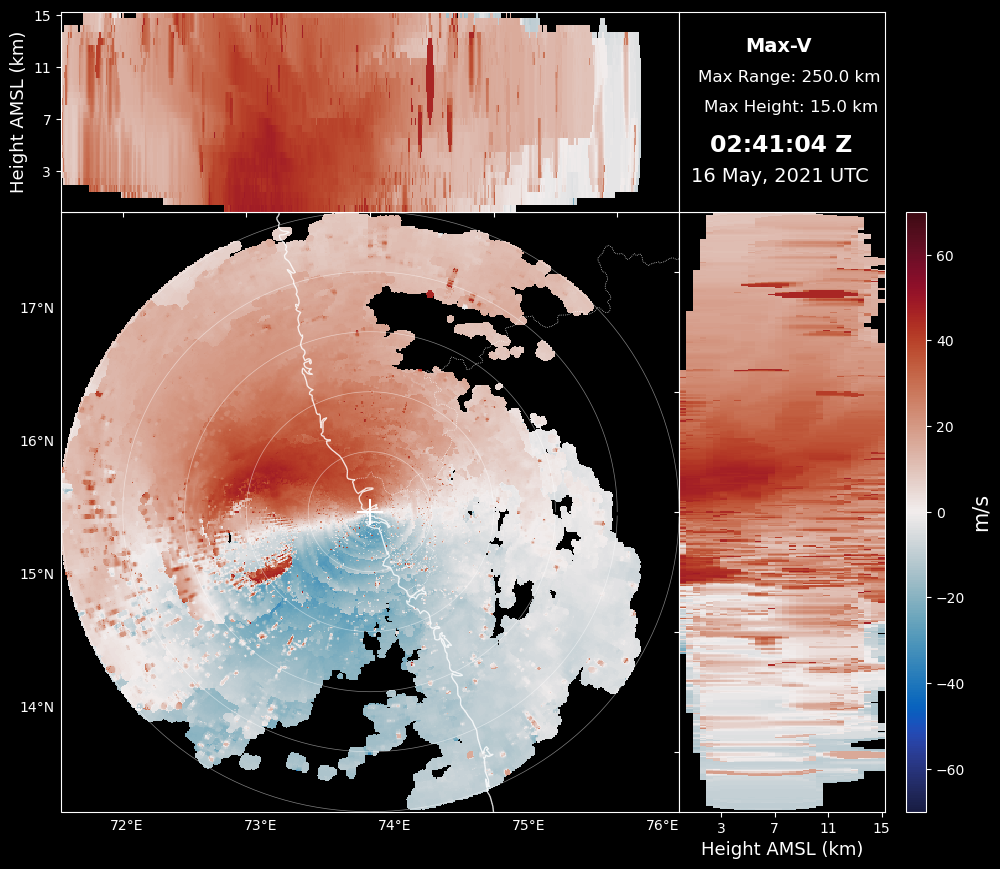
with plt.style.context(["dark_background"]):
    pcf.plot_cappi(
        grid,
        "V",
        vmin=-70,
        vmax=70,
        cmap="balance",
    )
plt.show()
...............................
Plotting Max-V 20210516024104
...............................
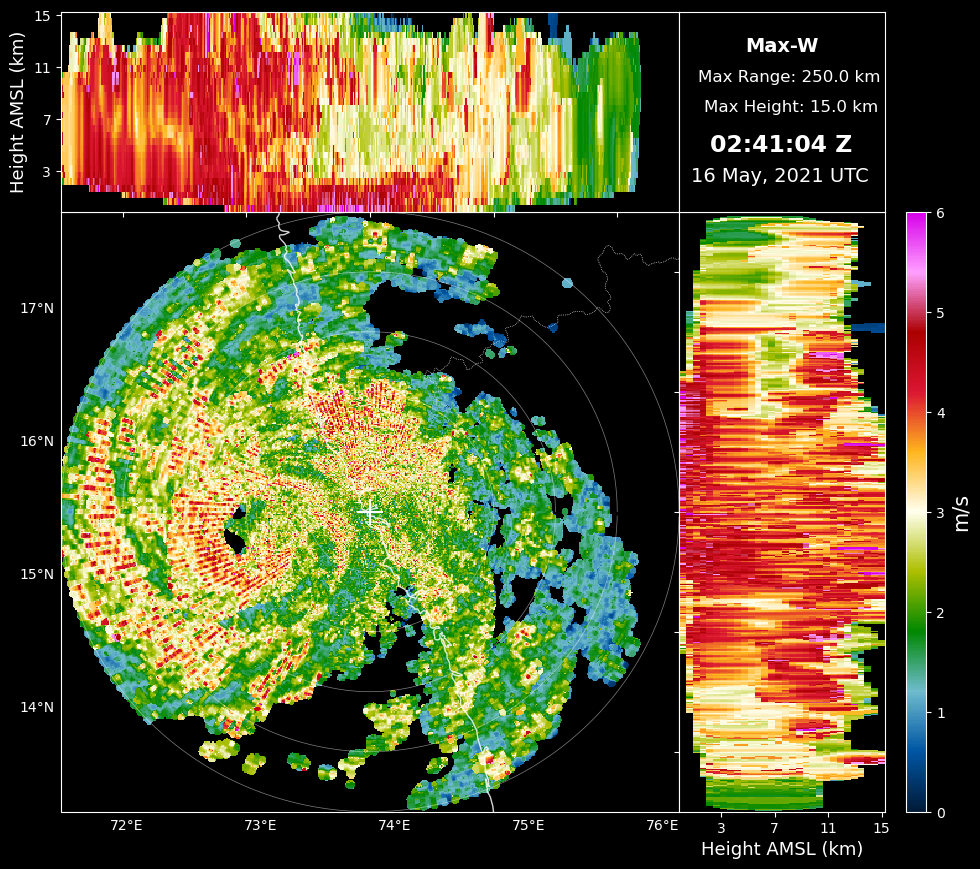
with plt.style.context(["dark_background"]):
    pcf.plot_cappi(
        grid,
        "W",
        vmin=0,
        vmax=6,
        cmap="SyedSpectral",
    )
plt.show()
...............................
Plotting Max-W 20210516024104
...............................